In this note we discuss isothermal, adiabatic, isobaric, and isochoric processes with an ideal gas. We begin by recalling a few basic principles from thermodynamics, and their application to a container of ideal gas, as shown in the figure below.

When the gas is at an absolute temperature ![]() , the molecules of the gas move around inside the container and bounce off its walls. Each gas molecule suffers a change in momentum upon such a collision, and the totality of all those collisions per unit time exerts a force on the walls of the container. The average of this force per unit area is called the pressure
, the molecules of the gas move around inside the container and bounce off its walls. Each gas molecule suffers a change in momentum upon such a collision, and the totality of all those collisions per unit time exerts a force on the walls of the container. The average of this force per unit area is called the pressure ![]() . If the volume
. If the volume ![]() of the enclosure is increased, by raising the piston say, the average distance that a molecule needs to travel between collisions also increases (see this problem). Thus, collisions of the gas molecules with the walls become less frequent and the pressure decreases. If we now raise the temperature of the gas the molecules start moving faster, and the pressure rises again. It is therefore intuitively apparent that the pressure, volume and temperature of the gas are related to one another. A more quantitative analysis of this picture is given in chapter 39 of The Feynman Lectures. For the present discussion, we will start with (39.11) from that chapter, which relates the pressure and volume to the internal energy
of the enclosure is increased, by raising the piston say, the average distance that a molecule needs to travel between collisions also increases (see this problem). Thus, collisions of the gas molecules with the walls become less frequent and the pressure decreases. If we now raise the temperature of the gas the molecules start moving faster, and the pressure rises again. It is therefore intuitively apparent that the pressure, volume and temperature of the gas are related to one another. A more quantitative analysis of this picture is given in chapter 39 of The Feynman Lectures. For the present discussion, we will start with (39.11) from that chapter, which relates the pressure and volume to the internal energy ![]() of the gas
of the gas
(1) ![]()
It was shown by Joule that the internal energy of the gas is a function of only the temperature, ![]() (see page 22 of Thermodynamics by E. Fermi). In fact
(see page 22 of Thermodynamics by E. Fermi). In fact ![]() is directly proprotional to the termperature of the gas,
is directly proprotional to the termperature of the gas,
(2) ![]()
For example, a monatomic gas has ![]() and
and ![]() which turns (1) into the familiar ideal gas law
which turns (1) into the familiar ideal gas law
(3) ![]()
Next, we remember the first law of thermodynamics which is essentially the statement of the principle of conservation of energy for thermodynamical systems. It states that the change in energy of the system during any transformation is equal to the amount of energy that the system receives from its environment. We can write this in the differential form
(4) ![]()
where ![]() is the heat energy supplied to the system and
is the heat energy supplied to the system and ![]() is the work done on the system. We know work is force
is the work done on the system. We know work is force ![]() displacement. The force needed to move the piston in figure is
displacement. The force needed to move the piston in figure is ![]() where
where ![]() is the cross-sectional area of the piston. As we compress the gas its pressure changes. If we displace the piston by a small
is the cross-sectional area of the piston. As we compress the gas its pressure changes. If we displace the piston by a small ![]() such that the pressure does not change appreciably, the differential work done on the gas is
such that the pressure does not change appreciably, the differential work done on the gas is
(5) ![]()
We have added a negative sign by hand so that when we compress the gas it’s volume decreases, ![]() , which makes
, which makes ![]() . In other words, work done on the gas is positive. Conversely, work done on the gas as it expands is negative. In some textbooks (4) is written as
. In other words, work done on the gas is positive. Conversely, work done on the gas as it expands is negative. In some textbooks (4) is written as ![]() in which case
in which case ![]() stands for the work done by the system. In either case the first law will be
stands for the work done by the system. In either case the first law will be ![]() when we express work in terms of pressure and volume.
when we express work in terms of pressure and volume.
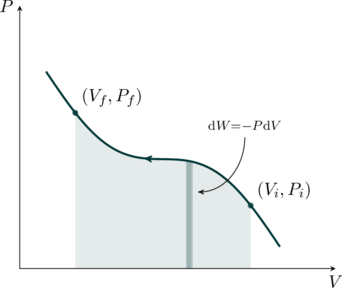
If we plot the pressure vis-a-vis the volume as in the figure, then total work done on the gas as we compress it from ![]() to
to ![]() is
is
(6) 
The relation (6) applies for all ideal gas processes. To carry out this integral we need to know the exact relationship between ![]() and
and ![]() . This will be subject of the rest of our discussion.
. This will be subject of the rest of our discussion.
Isothermal Process
In an isothermal process the temperature remains constant throughout. For example, consider a closed container of gas with a movable piston as shown in the figure below. The bottom wall of the container is assumed to a perfect conductor of heat. We can now place this assembly on a heat bath (also called a reservoir), which is a system that can absorb or release heat with no change to its temperature, ![]() . After a while the gas comes to equilibrium with the heat bath, reaching a temperature
. After a while the gas comes to equilibrium with the heat bath, reaching a temperature ![]() .
.

The heat bath maintains the temperature of the gas at ![]() , which means the internal energy of the gas cannot change (cf. (2)). Therefore, the r.h.s. of (1) is a constant (call it
, which means the internal energy of the gas cannot change (cf. (2)). Therefore, the r.h.s. of (1) is a constant (call it ![]() ),
),
(7) ![]()
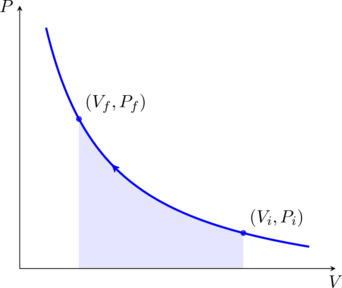
If the gas is monatomic the constant ![]() . We may now plot this relation on a pressure-volume (PV) diagram, as shown in the figure. These curves are called isotherms. Suppose we start out with a volume
. We may now plot this relation on a pressure-volume (PV) diagram, as shown in the figure. These curves are called isotherms. Suppose we start out with a volume ![]() of the gas at pressure
of the gas at pressure ![]() initially. We slowly compress the gas, allowing enough time for the gas to equilibriate with the bath at each step, so that the temperature is always
initially. We slowly compress the gas, allowing enough time for the gas to equilibriate with the bath at each step, so that the temperature is always ![]() . As we do so, we do work on the gas. Since the internal energy of the gas remains constant, this work is dumped as heat into the bath (cf. (4)). By the time we reach the point
. As we do so, we do work on the gas. Since the internal energy of the gas remains constant, this work is dumped as heat into the bath (cf. (4)). By the time we reach the point ![]() on the isotherm we would have done a total amount of work
on the isotherm we would have done a total amount of work
(8) ![]()
where we used (7) in the second step. Also by (7), ![]() . Therefore, we may write the above equation as
. Therefore, we may write the above equation as
(9) 
If the gas is monatomic we can use (3) to write
(10) ![]()
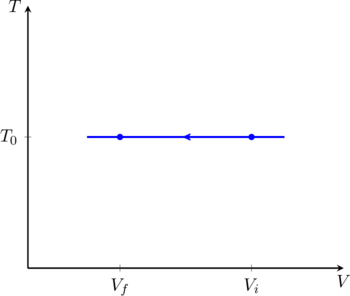
It is also instructive to see what the process looks like on a TV diagram, as shown in figure. We have denoted the reservoir temperature by ![]() to avoid confusion with the axis label
to avoid confusion with the axis label ![]() . This plot contains all the information we need to compute the work done directly, using (10).
. This plot contains all the information we need to compute the work done directly, using (10).
Adiabatic Process
If we keep an ideal gas in an thermally insulated container it can no longer exchange heat with it’s surroundings. That means ![]() in (4), and so
in (4), and so ![]() ; the work done on the gas raises the internal energy and temperature of the gas. Using this in (5), we have
; the work done on the gas raises the internal energy and temperature of the gas. Using this in (5), we have
(11) ![]()
Next, we take the derivative of (1) to obtain
(12) ![]()
Substituting this equation into the previous one we find
(13) ![]()
which can be integrated to obtain
(14) ![]()
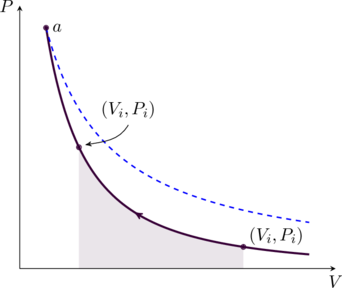
The relation (14) is plotted in figure in green. For comparison, we also show an isotherm (in dashed blue) which touches the adiabatic curve at point ![]() . The area under the latter is smaller because
. The area under the latter is smaller because ![]() since
since ![]() (cf. (1)). Therefore the work done to compress the gas from
(cf. (1)). Therefore the work done to compress the gas from ![]() to
to ![]() is smaller than it would be for an isothermal process. We can find an expression for this work on the gas using (6),
is smaller than it would be for an isothermal process. We can find an expression for this work on the gas using (6),
(15) ![]()
where we have used (14). Since ![]() , we may write
, we may write
(16) 
As mentioned above, the temperature of the gas increases as we compress it. We can find relations between the pressure, volume and temperature at every point of an adiabatic process. First, note that (1) and (2) imply ![]() for any gas. Then, (14) may be written as
for any gas. Then, (14) may be written as
(17) ![]()
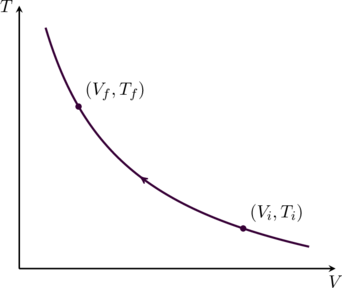
where ![]() is a new constant. We can plot this relationship on a TV diagram as shown in figure. The temperature and volume at the initial and final points on the adiabatic curve satisfy
is a new constant. We can plot this relationship on a TV diagram as shown in figure. The temperature and volume at the initial and final points on the adiabatic curve satisfy
(18) ![]()
Similarly, replacing the volume ![]() in (14) using
in (14) using ![]() gives
gives
(19) ![]()
Isobaric process
If the pressure of the gas is kept constant the process is called isobaric. If we denote this constant pressure as ![]() , the work done in compressing the gas from
, the work done in compressing the gas from ![]() to
to ![]() (see (figure)) is
(see (figure)) is
(20) ![]()

Furthermore, the temperature and volume are directly proportional to one another in this process. For a monatomic gas, (3) tells us
(21) ![]()
Therefore isobaric curves will be slanted lines on a TV diagram, with their slopes inversely proportional to ![]() (see figure).
(see figure).

Isochoric process
In an isochoric process the volume of the gas is kept constant, call it ![]() . Therefore
. Therefore ![]() which means
which means ![]() and
and ![]() . In other words, no work is done in this process and the heat exchanged between the gas and its surroundings simply changes the internal energy of the gas. If the gas is monatomic the pressure and temperature are directly proportional to one another,
. In other words, no work is done in this process and the heat exchanged between the gas and its surroundings simply changes the internal energy of the gas. If the gas is monatomic the pressure and temperature are directly proportional to one another,
(22) ![]()
Both the PV and TV diagrams for this process are trivial as shown in figure and figure.

 to
to  .
.
Related Problems:
Thermodynamic cycle on a VT diagram
Cyclic processes on a PV diagram
Ideal gas match list